Basic Usage
Aside from the python library, rNets comes with a command line executable. In
order to generate a reaction network with rnets we will require
2 files (one containing the species and another containing the reactions), and to
visualize it we will also require to have graphviz or any other
software capable of rendering image files from .dot files.
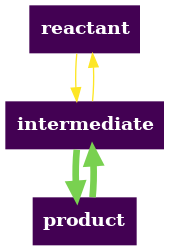
To illustrate the basic usage pipeline, lets assume that we have the files: compounds.csv and reactions.csv with the following contents:
compounds.csv
name,energy,fflags
reactant,0,b
intermediate,0,b
product,0,b
reactions.csv
cleft,cleft,cright,cright,energy,direction,name
reactant,,intermediate,,0.5,<->,R0
intermediate,,product,,0.4,<->,R1
For a detailed explanation on the contents and format of these files please check the File Formats section
The first step will be to generate a .dot file using the command line
executable:
python -m rnets -cf compounds.csv -rf reactions.csv -o output.dot
Here, we do not need to specify if we want a graph colored based only on
thermochemistry or based on concentrations. In the presence of concentration
values it will default to a concentration-based graph, while its absence will
default to a thermochemistry-based graph. output.dot is the name of the
.dot file that will be generated.
Next, we proceed to render the drawing into a png. For this we will use the
dot executable that comes with graphviz.
dot -Tpng output.dot -o output.png
With this we have generated the final graph of our reaction network.