Python API Examples
In this section we will cover examples using directly the python API interface instead of the command line. The usage of the python API facilitates the integration of python libraries such as pykinetic, which will also be covered in the examples.
My first Network
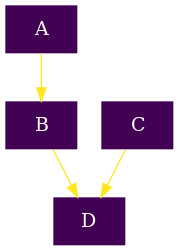
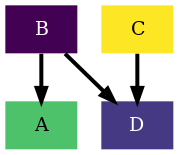
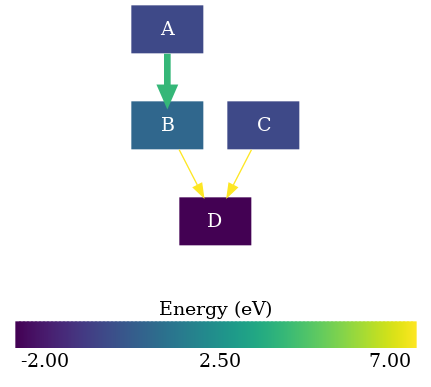
To introduce the basic components of the python API of rNets we will create a very simple reaction network, which is shown below:
The first thing is importing the appropriate classes. The Network class
is within the struct struct module
from rnets.struct import Network
A network is composed of Compound and Reaction objects, are also
in the same module
from rnets.struct import Compound, Reaction
Now that we have the basic building blocks we can proceed to define our different compounds, namely A, B, C and D
A = Compound(name='A',energy=0.0,idx=0)
B = Compound('B',1.0,1)
C = Compound('C',0.0,2)
D = Compound('D',-2.0,3)
Here, the minimal parameters needed to define a compound are: name
, energy, idx . The default energy unit is eV so
according to the previous code, B is 1eV higher in energy than
A while D is 2eV lower in energy. The idx value
is used to uniquely identify each compound. This allows more freedom to the
value of name as there are no constraints on the text that can be used.
After defining the compounds, we can now proceed to define the reactions:
reactants = (A,)
products = (B,)
r1 = Reaction(name='r1',
              compounds=(reactants,products),
              energy=4.0,
              idx=0)
r2 = Reaction('r2',((B,C),(D,)),7.0,1)
The name and idx parameters are used to identify the reaction
in an user-friendly and code-friendly, respectively, but have no effect on the
final representation. The compounds parameter is a tuple composed from
reactants and products, in both cases a tuple containing 1 or more
Compounds . The energy corresponds to the energy of the
transition state corresponding to the reaction. In these examples the transition
states are 20eV higher than A and C .
Finally we proceed to create the network:
nw = Network(compounds=(A,B,C,D),reactions=(r1,r2))
This is quite straightforward as we have all the pieces together. Putting together all the previous code snippets:
from rnets.struct import Network, Compound, Reaction

A = Compound('A',0.0,0)
B = Compound('B',1.0,1)
C = Compound('C',0.0,2)
D = Compound('D',-2.0,3)

r1 = Reaction('r1',((A,),(B,)),4.0,0)
r2 = Reaction('r2',((B,C),(D,)),7.0,1)

nw = Network(compounds=(A,B,C,D),reactions=(r1,r2))
As we now have the network created we can proceed to draw the graphs which is in the topic of the next two examples.
Drawing a thermodynamic graph
For an introduction to the different components of a Network please
check the My first Network
To draw the reaction network we will use the plotter module. As in this
example we will be coloring the nodes based on the energies of the compounds and
the color and thickness of the of the edges based on the barriers, we will
specifically use the thermo submodule. In the Drawing a kinetic graph
we use the kinetic instead.
from rnets.plotter.thermo import build_dotgraph
Together with the network generation we have the following code:
from rnets.struct import Network, Compound, Reaction
from rnets.plotter.thermo import build_dotgraph

A = Compound('A',0.0,0)
B = Compound('B',1.0,1)
C = Compound('C',0.0,2)
D = Compound('D',-2.0,3)

r1 = Reaction('r1',((A,),(B,)),4.0,0)
r2 = Reaction('r2',((B,C),(D,)),7.0,1)

nw = Network(compounds=(A,B,C,D),reactions=(r1,r2))
Now, we proceed to the generation of the dotfile contents and to write them:
graph = build_dotgraph(nw)

with open("example1.dot", 'w', encoding="utf8") as of:
    of.write(str(graph))
After we have generated our .dot file all that remains is to transform
it into an image format, which we can do with any of graphviz's tools. As we
are doing these examples in python we will use python to call the dot
tool:
import subprocess
subprocess.run('dot -Tpng example1.dot -o example1.png',shell=True)
With this we will have generated a basic reaction network completely using rNets' python API. Putting all together:
import subprocess

from rnets.struct import Network, Compound, Reaction
from rnets.plotter.thermo import build_dotgraph

# Creation of the reaction network
A = Compound('A',0.0,0)
B = Compound('B',1.0,1)
C = Compound('C',0.0,2)
D = Compound('D',-2.0,3)

r1 = Reaction('r1',((A,),(B,)),4.0,0)
r2 = Reaction('r2',((B,C),(D,)),7.0,1)

nw = Network(compounds=(A,B,C,D),reactions=(r1,r2))

# Creation of the graph and saving it as a .dot file.
graph = build_dotgraph(nw)

with open("example.dot", 'w', encoding="utf8") as of:
    of.write(str(graph))

# Generating a PNG from the created .dot file
subprocess.run('dot -Tpng example.dot -o example.png',shell=True)
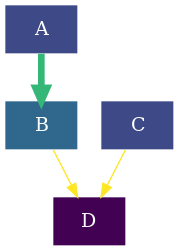
Drawing a kinetic graph
For an introduction to the different components of a Network please
check the My first Network
To draw the reaction network we will use the plotter module. As in this
example we will be coloring the nodes based on the energies of the compounds and
the color and thickness of the of the edges based on the barriers, we will
specifically use the kinetic submodule. In the Drawing a thermodynamic graph
we use the thermo instead.
from rnets.plotter.kinetic import build_dotgraph
Contrary to the Drawing a thermodynamic graph example, here it is needed to modify the creation of the network, as we need to provide information about the concentrations of each compound. The units of the concentrations have to be consistent with the energy units, since the rates of the reactions will be computed based on the energies and concentrations.
from rnets.struct import Network, Compound, Reaction
from rnets.plotter.kinetic import build_dotgraph

A = Compound('A',0.0,0,conc=0.75)
B = Compound('B',1.0,1,conc=0.1)
C = Compound('C',0.0,2,conc=1.0)
D = Compound('D',-2.0,3,conc=0.25)

r1 = Reaction('r1',((A,),(B,)),4.0,0)
r2 = Reaction('r2',((B,C),(D,)),7.0,1)

nw = Network(compounds=(A,B,C,D),reactions=(r1,r2))
Note
For the example we are going to use arbitrary numbers, but these numbers can be read from an existing file containing the output of a kinetic simulation software.
Now, we proceed to the generation of the dotfile contents and to write them:
graph = build_dotgraph(nw)

with open("example.dot", 'w', encoding="utf8") as of:
    of.write(str(graph))
After we have generated our .dot file all that remains is to transform
it into an image format, which we can do with any of graphviz's tools. As we
are doing these examples in python we will use python to call the dot
tool:
import subprocess
subprocess.run('dot -Tpng example.dot -o example.png',shell=True)
With this we will have generated a basic reaction network completely using rNets' python API. Putting all together:
import subprocess

from rnets.struct import Network, Compound, Reaction
from rnets.plotter.kinetic import build_dotgraph

# Creation of the reaction network
A = Compound('A',0.0,0,conc=0.75)
B = Compound('B',1.0,1,conc=0.1)
C = Compound('C',0.0,2,conc=1.0)
D = Compound('D',-2.0,3,conc=0.25)

r1 = Reaction('r1',((A,),(B,)),4.0,0)
r2 = Reaction('r2',((B,C),(D,)),7.0,1)

nw = Network(compounds=(A,B,C,D),reactions=(r1,r2))

# Creation of the graph and saving it as a .dot file.
graph = build_dotgraph(nw)

with open("example.dot", 'w', encoding="utf8") as of:
    of.write(str(graph))

# Generating a PNG from the created .dot file
subprocess.run('dot -Tpng example.dot -o example.png',shell=True)
Using different energy units or temperature
In this example we will get introduced to the chemical configuration class
( rnets.chemistry.ChemCfg ). to illustrate its usage we will borrow the
Drawing a kinetic graph example.
First we will add to the imports the Chemcfg
import subprocess

from rnets.struct import Network, Compound, Reaction
from rnets.plotter.kinetic import build_dotgraph
from rnets.chemistry import ChemCfg
Next, we are going to define our reaction network in kcal/mol
A = Compound('A',0.0,0,conc=0.75)                  # 0.0 eV
B = Compound('B',23.1,1,conc=0.1)                  # 1.0 eV
C = Compound('C',0.0,2,conc=1.0)                   # 0.0 eV
D = Compound('D',-46.1,3,conc=0.25)                # -2.0 eV

r1 = Reaction('r1',((A,),(B,)),92.2,0)    # 4.0 eV
r2 = Reaction('r2',((B,C),(D,)),161.4,1)  # 7.0 eV

nw = Network(compounds=(A,B,C,D),reactions=(r1,r2))
The next step is to instantiate our chemical configuration object.
chem_cfg = ChemCfg(e_units='kcal/mol')
If the energies provided were at a reference state of 500K it is also specified at the chemical configuration:
chem_cfg = ChemCfg(e_units='kcal/mol',T=500)
Now, we proceed to the generation of the dotfile using the
kinetic.build_dotgraph function. Here we need to specify as a parameter
of the function the chemical configuration object.
graph = build_dotgraph(nw,chem_cfg=chem_cfg)
Finally, we proceed as in the other examples to write the .dot file and
transform it to a .png
with open("example.dot", 'w', encoding="utf8") as of:
    of.write(str(graph))

subprocess.run('dot -Tpng example.dot -o example.png',shell=True)
When we put all the steps together we end up with the following code:
import subprocess

from rnets.struct import Network, Compound, Reaction
from rnets.plotter.kinetic import build_dotgraph
from rnets.chemistry import ChemCfg

# Creation of the reaction network
A = Compound('A',0.0,0,conc=0.75)                  # 0.0 eV
B = Compound('B',23.1,1,conc=0.1)                  # 1.0 eV
C = Compound('C',0.0,2,conc=1.0)                   # 0.0 eV
D = Compound('D',-46.1,3,conc=0.25)                # -2.0 eV

r1 = Reaction('r1',((A,),(B,)),92.2,0)    # 4.0 eV
r2 = Reaction('r2',((B,C),(D,)),161.4,1)  # 7.0 eV

nw = Network(compounds=(A,B,C,D),reactions=(r1,r2))

# Creation of the Chemical Configuration
chem_cfg = ChemCfg(e_units='kcal/mol')

# Creation of the graph and saving it as a .dot file.
graph = build_dotgraph(nw)

with open("example.dot", 'w', encoding="utf8") as of:
    of.write(str(graph))

# Generating a PNG from the created .dot file
subprocess.run('dot -Tpng example.dot -o example.png',shell=True)
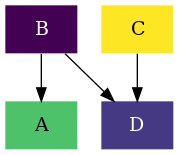
Formatting our graph
In this example we will get introduced to the Graph, Edge and Node configuration
classes ( rnets.plotter.utils.GraphCfg ,
rnets.plotter.utils.EdgeCfg and rnets.plotter.utils.NodeCfg).
To illustrate their usage we will borrow the Drawing a kinetic graph example
and we will change the width of the edges as well as the colorscheme.
Note
In the following examples, only the GraphCfg and EdgeCfg
classes will be used, however the usage of NodeCfg is similar
to EdgeCfg .
First we will add to the imports the GraphCfg and EdgeCfg classes:
import subprocess

from rnets.struct import Network, Compound, Reaction
from rnets.plotter.kinetic import build_dotgraph
from rnets.plotter.utils import GraphCfg, EdgeCfg
Next, we are going to define our reaction network
A = Compound('A',0.0,0,conc=0.75)
B = Compound('B',1.0,1,conc=0.1)
C = Compound('C',0.0,2,conc=1.0)
D = Compound('D',-2.0,3,conc=0.25)

r1 = Reaction('r1',((A,),(B,)),4.0,0)
r2 = Reaction('r2',((B,C),(D,)),7.0,1)

nw = Network(compounds=(A,B,C,D),reactions=(r1,r2))
The next step is to instantiate our edge configuration object.
edge_cfg = EdgeCfg(width=3)
First, we will generate the graph without changing the colorscheme which is a
format of the graph, but we still need to create a GraphCfg object, to
include our EdgeCfg object:
graph_cfg = GraphCfg(edge=edge_cfg)
and proceed to generate our graph, dotfile and png as in the previous examples:
graph = build_dotgraph(nw,graph_cfg=graph_cfg)

with open("example.dot", 'w', encoding="utf8") as of:
    of.write(str(graph))

subprocess.run('dot -Tpng example.dot -o example.png',shell=True)
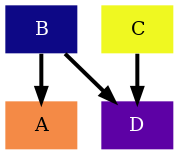
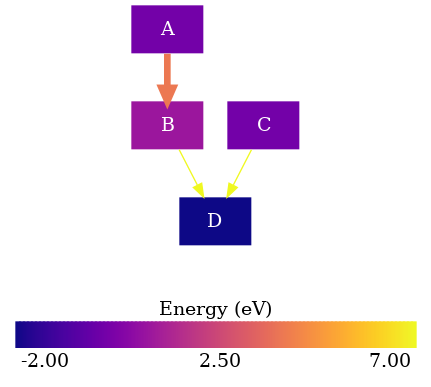
Second, if we also want to change the color scheme, we need to specify it when
we create the GraphCfg object. all we will need to do is to
specify a sequence of floats. The default colorscheme is viridis which
is pre-defined in rnets.colors.colorschemes.VIRIDIS . Here we can
find other pre-defined colorschemes such as magma, plasma,
inferno and cividis (All in uppercase). To use a pre-defined
color scheme the easiest will be to import it:
from rnets.colors import PLASMA
Now we instantiate the GraphCfg object
graph_cfg = GraphCfg(edge=edge_cfg,colorscheme=PLASMA)
And the remaining steps are the same ones as before:
graph = build_dotgraph(nw,graph_cfg=graph_cfg)

with open("example.dot", 'w', encoding="utf8") as of:
    of.write(str(graph))

subprocess.run('dot -Tpng example.dot -o example.png',shell=True)
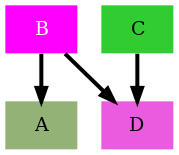
If instead we want to define our own colorscheme, we need to specify a sequence
of colors, represented as tuples of RGB values between 0 and 1. For
convenience when defining custom colorschemes, we can find a dictionary with
some name to RGB tuple mapping at rnets.colors.palettes that we can use:
from rnets.colors.palettes import css as colorname_to_rgb

my_colorscheme = ['magenta','limegreen']
colorscheme = [colorname_to_rgb[name] for name in my_colorscheme]
As we did before, we now define our GraphCfg object with our custom
colorscheme and proceed to generate the graph, .dot file and
.png
graph_cfg = GraphCfg(edge=edge_cfg,colorscheme=colorscheme)

graph = build_dotgraph(nw,graph_cfg=graph_cfg)

with open("example.dot", 'w', encoding="utf8") as of:
    of.write(str(graph))

subprocess.run('dot -Tpng example.dot -o example.png',shell=True)
When we put all the steps together we end up with the following code:
import subprocess

from rnets.struct import Network, Compound, Reaction
from rnets.plotter.kinetic import build_dotgraph
from rnets.plotter.utils import GraphCfg, EdgeCfg
from rnets.colors.colorschemes import PLASMA

# Creation of the reaction network
A = Compound('A',0.0,0,conc=0.75)
B = Compound('B',1.0,1,conc=0.1)
C = Compound('C',0.0,2,conc=1.0)
D = Compound('D',-2.0,3,conc=0.25)

r1 = Reaction('r1',((A,),(B,)),4.0,0)
r2 = Reaction('r2',((B,C),(D,)),7.0,1)

nw = Network(compounds=(A,B,C,D),reactions=(r1,r2))

# Formatting
edge_cfg = EdgeCfg(width=3)
graph_cfg = GraphCfg(edge=edge_cfg,colorscheme=PLASMA)

# Creation of the graph and saving it as a .dot file.
graph = build_dotgraph(nw,graph_cfg=graph_cfg)

with open("example.dot", 'w', encoding="utf8") as of:
    of.write(str(graph))

# Generating a PNG from the created .dot file
subprocess.run('dot -Tpng example.dot -o example.png',shell=True)
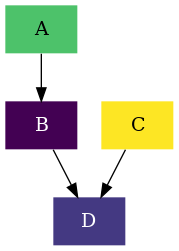
Adding a colorbar legend
In this example we will add a colorbar to our graph using the ColorbarCfg class
( rnets.addons.colorbar.ColorbarCfg)
To illustrate their usage we will borrow the Drawing a thermodynamic graph .
Note
Currently only the addition of a colorbar is only accessible through the python API, although it will be included as an option in the commandline parser in future versions.
First we will add to the imports the ColorbarCfg class:
import subprocess

from rnets.struct import Network, Compound, Reaction
from rnets.plotter.thermo import build_dotgraph
from rnets.addons.colorbar import ColorbarCfg
Next, we are going to define our reaction network
from rnets.struct import Network, Compound, Reaction
from rnets.plotter.thermo import build_dotgraph

A = Compound('A',0.0,0)
B = Compound('B',1.0,1)
C = Compound('C',0.0,2)
D = Compound('D',-2.0,3)

r1 = Reaction('r1',((A,),(B,)),4.0,0)
r2 = Reaction('r2',((B,C),(D,)),7.0,1)

nw = Network(compounds=(A,B,C,D),reactions=(r1,r2))
The next step is to instantiate our colorbar configuration object. For now we will use the default configuration.
colorbar_cfg = ColorbarCfg()
Finally, we need to provide during the generation of our graph. Followed by the already usual steps of writing it to a file and running dot to generate the .png file:
graph = build_dotgraph(nw,colorbar_cfg=colorbar_cfg)

with open("example.dot", 'w', encoding="utf8") as of:
    of.write(str(graph))

subprocess.run('dot -Tpng example.dot -o example.png',shell=True)
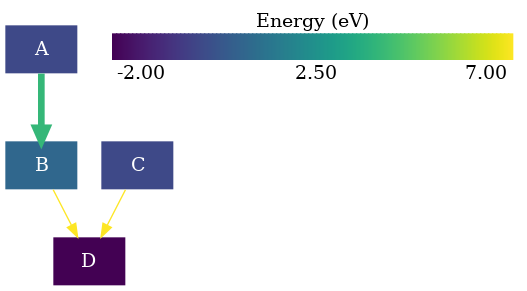
The position of the colorbar can be tricky. If we do not want to generate the graph as an SVG to freely edit it, we can try to anchor it to a node. To illustrate the example we will anchor it to the 'D' node. All we need to do is to specify it on the creation of the colorbar configuration object:
colorbar_cfg = ColorbarCfg(anchor='D')

graph = build_dotgraph(nw,colorbar_cfg=colorbar_cfg)

with open("example.dot", 'w', encoding="utf8") as of:
    of.write(str(graph))

subprocess.run('dot -Tpng example.dot -o example.png',shell=True)
The colorbar is dependent on the plotter which means that if we want to change the colorscheme we can do it as indicated in the previous example without any extra steps.
from rnets.colors import PLASMA
from rnets.plotter.utils import GraphCfg
Now we instantiate the GraphCfg object
graph_cfg = GraphCfg(colorscheme=PLASMA)
And the remaining steps are the same ones as before:
graph = build_dotgraph(nw,graph_cfg=graph_cfg, colorbar_cfg=colorbar_cfg)

with open("example.dot", 'w', encoding="utf8") as of:
    of.write(str(graph))

subprocess.run('dot -Tpng example.dot -o example.png',shell=True)
When we put all the steps together we end up with the following code:
import subprocess

from rnets.struct import Network, Compound, Reaction
from rnets.plotter.thermo import build_dotgraph
from rnets.plotter.utils import GraphCfg
from rnets.colors.colorschemes import PLASMA
from rnets.addons.colorbar import ColorbarCfg

# Creation of the reaction network
A = Compound('A',0.0,0)
B = Compound('B',1.0,1)
C = Compound('C',0.0,2)
D = Compound('D',-2.0,3)

r1 = Reaction('r1',((A,),(B,)),4.0,0)
r2 = Reaction('r2',((B,C),(D,)),7.0,1)

nw = Network(compounds=(A,B,C,D),reactions=(r1,r2))

# Formatting
graph_cfg = GraphCfg(colorscheme=PLASMA)

# Colorbar
colorbar_cfg = ColorbarCfg(anchor='D')

# Creation of the graph and saving it as a .dot file.
graph = build_dotgraph(nw,graph_cfg=graph_cfg,colorbar_cfg=colorbar_cfg)

with open("example.dot", 'w', encoding="utf8") as of:
    of.write(str(graph))

# Generating a PNG from the created .dot file
subprocess.run('dot -Tpng example.dot -o example.png',shell=True)
Integration with other software: Pykinetic (thermo)
Note
Currently under construction: An example of how to adapt pykinetics classes to generate a thermodynamic graph
Integration with other software: Pykinetic (kinetic)
Note
Currently under construction: An example of how to adapt pykinetics classes to generate a kinetic graph